B
BRAINBAY

Project Controls · Intelligence · AI

Categories
Project Controls

Construction Progress Measurement Management Can Trust

Project Controls

Construction Progress Measurement Management Can Trust

11 August 2026 — Christian Ramos

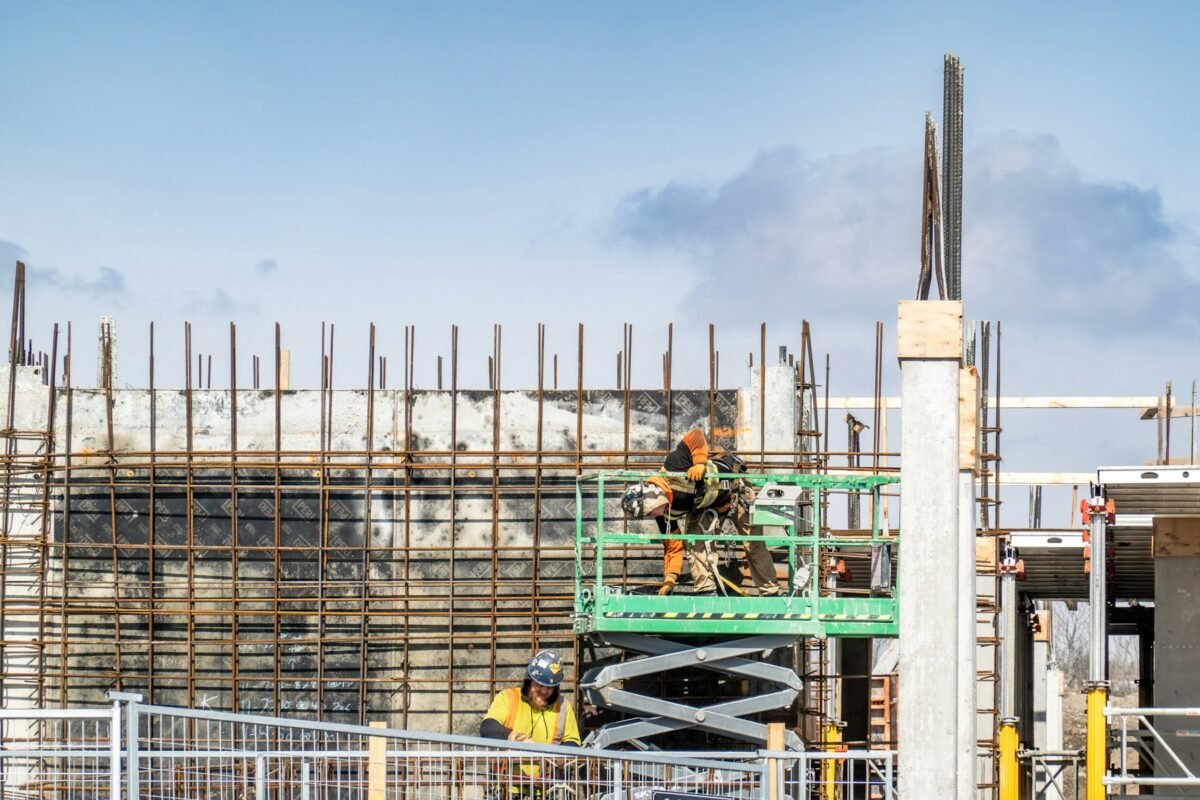
Active construction work used as evidence for reliable progress measurement
Trusted progress starts with observable work, consistent rules and evidence. Photo by chris robert via Unsplash.

Reliable construction progress measurement gives management a factual answer to a simple question: how much of the approved scope is genuinely complete at the reporting cut-off?
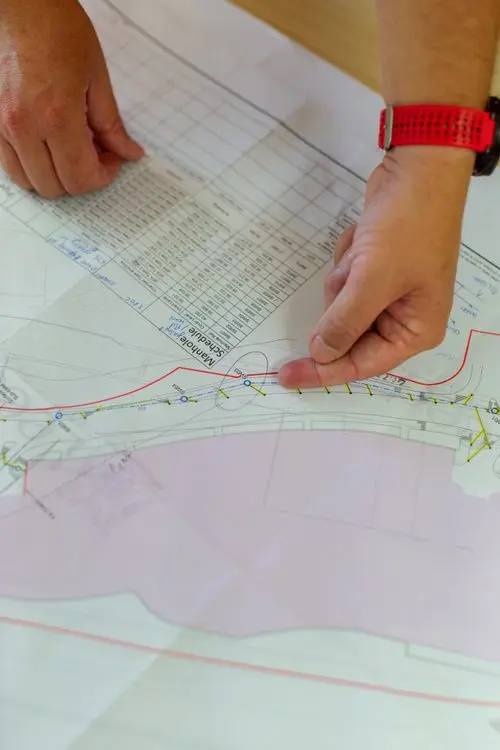
Project controls team validating construction progress measurement using site quantities

The calculation becomes difficult when drawings change, work is partially complete, quantities are uncertain, or different teams use different definitions of “done.” A strong system removes that ambiguity before the reporting cycle begins.

Define the purpose of construction progress measurement

Progress may be used for schedule control, client reporting, payment, earned value, productivity, or forecasting. These purposes are related but not identical.

For example, an activity can be physically 80% complete while only 60% is approved for payment because inspections or supporting documents remain outstanding. The report must say which progress definition it uses.

Establish a measurable scope baseline

Start with an approved scope broken down by work breakdown structure, discipline, area, activity, or control account. For quantity-based work, record the budget quantity and unit of measure.

Typical units include:

  • Square metres for flooring, cladding, waterproofing, or painting.
  • Cubic metres for concrete or excavation.
  • Tonnes for structural steel.
  • Linear metres for piping, cable, kerbs, or skirting.
  • Counts for equipment, rooms, panels, or deliverables.

If the scope baseline changes, control the revision. Do not quietly overwrite the denominator, because the reported percentage may move even when no new work was completed.

Use clear rules of credit

Rules of credit divide an activity into objective steps. This is useful when a deliverable or installation cannot be measured fairly with one all-or-nothing status.

For a typical material cycle, the weighting might be:

StepExample credit
Shop drawing approved10%
Material approved and ordered15%
Fabrication complete25%
Delivered to site15%
Installed25%
Inspected and accepted10%

The percentages are only examples. Agree project-specific rules before progress is claimed, and avoid front-loading too much credit to early steps.

Set one cut-off date

All disciplines should report against the same cut-off. Quantities installed after the cut-off belong to the next period, even if the report is prepared several days later.

Record:

  • Reporting period.
  • Data date or cut-off date.
  • Date of site measurement.
  • Schedule version.
  • Quantity-register revision.

This simple control prevents double counting and late adjustments that cannot be verified.

Require supporting evidence

Every claimed quantity should be traceable. Depending on the work, evidence may include:

  • Approved inspection requests.
  • Marked-up drawings.
  • Dated site photographs.
  • Delivery notes.
  • Survey records.
  • Signed daily reports.
  • Test results or commissioning sheets.
  • BIM model status or asset records.

Photographs support the record, but they should not replace measured quantities. Add the date, location, and activity reference.

Separate installed, inspected, and accepted progress

One of the most useful controls is to report these stages separately.

  • Installed: Physical work has been placed.
  • Inspected: The work has been presented for review.
  • Accepted: The inspection or deliverable has been approved.

This shows where production is moving faster than quality closeout and helps management focus on the real bottleneck.

Calculate weighted progress transparently

For a quantity-based activity:

Activity progress = completed quantity ÷ budget quantity

For a weighted programme:

Overall progress = sum of each activity’s weight × activity progress

Weights may be based on cost, labor hours, quantity value, or an approved blended method. The basis must remain consistent.

Avoid averaging percentages without weights. Completing 100% of a small activity should not have the same effect as completing 100% of a major work package.

Reconcile progress with the schedule

Schedule status and progress registers should tell the same story. Review differences such as:

  • Physical progress claimed without an Actual Start.
  • Completed activity with remaining duration or quantity.
  • High percentage complete but no inspection evidence.
  • Installed quantity greater than the approved budget quantity.
  • Progress claimed in an area that has not been handed over.
  • Earned value that does not match the approved weighting.

Oracle’s P6 activity status guidance describes the fields used to review duration, dates, units, costs, float, and completion percentages.

Report variance, not only the percentage

Management needs to know whether progress is ahead or behind and why.

Show:

  • Planned progress.
  • Actual progress.
  • Variance.
  • Period progress.
  • Required rate to meet the next milestone.
  • Main drivers and corrective actions.

A progress curve is useful, but it should be supported by area, discipline, or work-package detail. A single overall percentage can hide serious slippage on the controlling path.

Protect the audit trail

Keep monthly snapshots of source files and approvals. Lock prior-period actuals unless a correction is formally documented. Record who prepared, checked, and approved the data.

A reviewer should be able to reproduce the reported percentage using the saved quantity register, rules of credit, evidence, and schedule version.

Common mistakes

  • Changing weights after progress has started without approval.
  • Counting delivered material as installed work.
  • Using subjective percentages without rules of credit.
  • Mixing cut-off dates between teams.
  • Double counting rework or relocated material.
  • Updating the overall percentage without the underlying quantities.
  • Treating payment certification as identical to physical progress.
  • Reporting precision that the source data cannot support.

Final takeaway

Construction progress measurement becomes trustworthy when scope, quantities, weights, cut-off dates, and evidence are controlled consistently. The system should be simple enough for site teams to maintain and detailed enough for management to verify.

Learn more about my project controls experience or contact me for help setting up progress registers, earned-value reporting, or Power BI dashboards.

Frequently asked questions

What is the best basis for construction progress?

Use measurable quantities where possible. For engineering, procurement, testing, and closeout deliverables, use agreed milestone weights or rules of credit.

How often should progress be measured?

Daily site records support weekly control, while formal progress is commonly consolidated weekly or monthly using one agreed cut-off date.

Can physical progress exceed payment progress?

Yes. Work may be installed but not yet inspected, accepted, documented, or certified for payment. Report the definitions separately.

Categories
Reporting

How to Connect Primavera P6 and Power BI for Better Reporting

Reporting

How to Connect Primavera P6 and Power BI for Better Reporting

11 August 2026 — Christian Ramos

Analytics dashboard illustrating Primavera P6 and Power BI reporting
The reporting layer should turn schedule data into decisions, not just more charts. Photo by Luke Chesser via Unsplash.

A Primavera P6 Power BI dashboard can turn thousands of schedule rows into a clear management view. The value does not come from adding more charts. It comes from creating a reliable data flow, defining each KPI, and making sure the dashboard agrees with the source programme.

Primavera P6 Power BI dashboard displayed beside a construction schedule

This practical workflow covers the connection, data model, measures, visuals, refresh, and quality checks needed for construction reporting.

Choose a Primavera P6 Power BI connection method

The best connection depends on the available access and reporting frequency.

Common options are:

  1. Excel export: Simple and accessible for monthly reporting.
  2. XER or XML transformation: Useful when detailed schedule data must be processed consistently.
  3. P6 database connection: Suitable for controlled enterprise environments with approved read access.
  4. API or integration layer: Best for repeatable automated reporting where supported.
  5. Data warehouse: Useful when P6 must be combined with cost, procurement, document, and site systems.

For many project teams, a controlled Excel export is a good starting point. Automation should come after the definitions and validation are stable.

Export the fields management actually needs

Avoid bringing every P6 column into the model. Start with fields that support the decisions in the report.

Typical schedule fields include:

  • Project ID and project name.
  • WBS code and WBS name.
  • Activity ID and activity name.
  • Activity type and status.
  • Original and remaining duration.
  • Planned, actual, remaining, early, and late dates.
  • Total float and longest-path indicator.
  • Activity and performance percent complete.
  • Calendar.
  • Responsible manager.
  • Activity codes for area, discipline, contractor, and priority.
  • Baseline dates and variances.
  • Budget, actual, remaining, and earned-value fields where approved.

Oracle’s P6 activity-date reference is useful when deciding which date field belongs in a KPI.

Create a clean export process

Use the same layout, filters, field order, and file naming convention every reporting period. Include the data date in the file and in the dataset.

A simple folder structure might be:

  • Current export.
  • Previous approved exports.
  • Baseline export.
  • Mapping tables.
  • Validation results.

Do not overwrite the only copy of a previous period. Historical snapshots are essential for trend and movement analysis.

Transform the data in Power Query

Power Query should perform repeatable cleaning steps, not manual fixes that disappear next month.

Typical transformations include:

  • Setting correct data types.
  • Removing blank or duplicate rows.
  • Standardizing activity-status values.
  • Splitting WBS or activity-code structures.
  • Mapping area and contractor names.
  • Creating reporting periods and date tables.
  • Appending monthly snapshots.
  • Flagging invalid or missing dates.

Microsoft’s Power BI data connection documentation explains supported sources, gateways, and refresh concepts.

Build a simple star schema

Avoid one massive table if the dashboard combines schedules, progress, and reference data. A practical model may contain:

  • FactActivities: one row per activity per snapshot.
  • DimDate: calendar and reporting periods.
  • DimProject: project and programme information.
  • DimWBS: WBS hierarchy.
  • DimCode: area, discipline, contractor, or priority mappings.
  • FactProgress: quantity or earned-value records where needed.

Use stable keys. Activity ID alone may not be unique across several projects, so combine it with Project ID when necessary.

Define KPIs before designing visuals

Write each measure in plain English first. Examples include:

  • Current forecast finish.
  • Variance from baseline finish.
  • Activities started and completed this period.
  • Critical or near-critical activities.
  • Milestones due in the next 30, 60, and 90 days.
  • Delayed activities by responsible party.
  • Planned versus actual progress.
  • Schedule performance index, where the earned-value basis is approved.
  • Open ends, constraints, or negative float.
  • Movement from the previous update.

For every KPI, state the source field, formula, filters, cut-off date, and owner.

Design the dashboard around decisions

A useful management page can include:

  1. Project data date and update status.
  2. Overall planned and actual progress.
  3. Forecast completion and variance.
  4. Key milestones.
  5. Critical and near-critical work.
  6. Area or discipline performance.
  7. Main delay drivers and required actions.
  8. Trend from previous reporting periods.

Use detailed tables for investigation and simple charts for comparison. Avoid decorative gauges that make small differences look dramatic.

Validate every refresh

Before sharing the report, reconcile it with P6.

Check:

  • Activity count by project.
  • Data date.
  • Project and milestone finish dates.
  • Number of completed and in-progress activities.
  • Minimum and maximum dates.
  • Critical activity count.
  • Planned and actual progress totals.
  • Budget, earned value, and variance totals.
  • Missing or unmapped activity codes.

If one key figure differs, stop and identify the reason. A visually polished dashboard is not useful when management cannot trust the numbers.

Plan the refresh and ownership

For manual reporting, assign one person to place the approved export in the controlled folder and one person to validate the refreshed report.

For automated reporting, document credentials, gateway ownership, refresh timing, failure alerts, and the fallback process. Microsoft’s overview of Power BI data refresh explains the main refresh dependencies and options.

Keep the report analytics-friendly

Use descriptive internal and external links, clear calls to action, and stable page URLs when the dashboard is embedded or linked from a website. Google Analytics 4 can automatically measure eligible outbound-link clicks through enhanced measurement; Google provides a guide to measuring outbound clicks.

Do not place confidential project data, personal information, or credentials in a public embedded report. Apply workspace permissions and row-level security where required.

Common mistakes

  • Exporting different columns every month.
  • Mixing planned, baseline, and remaining dates.
  • Using Activity ID as a global key across projects.
  • Calculating percentages from unapproved weights.
  • Hiding the data date.
  • Building visuals before defining KPIs.
  • Refreshing data without reconciliation.
  • Publishing confidential schedule details publicly.

Final takeaway

A Primavera P6 Power BI solution should make schedule information easier to trust and act on. Start with a controlled export, a clean model, clearly defined KPIs, and a repeatable validation process. Automation is valuable only after those foundations are stable.

Learn more about my Power BI and project controls work or contact me to discuss a reporting dashboard for your project.

Frequently asked questions

Can Power BI connect directly to Primavera P6?

Yes, depending on the P6 environment, permissions, database, API, or integration tools available. Many teams begin with controlled Excel exports because they are easier to govern.

What is the most important field to show on a schedule dashboard?

Always show the project data date. Without it, users cannot tell how current the forecast and progress values are.

How often should the dashboard refresh?

Refresh after the schedule has been properly statused, calculated, checked, and approved for the reporting cycle. A faster refresh is not automatically a better refresh.