B
BRAINBAY

Project Controls · Intelligence · AI

Categories
Uncategorized

Earned Value Management for Construction: A Practical Project Controls Guide

PROJECT CONTROLS · EVM

Earned Value Management for Construction: A Practical Project Controls Guide

How PV, EV, AC, SPI and CPI turn progress and cost data into a disciplined management signal.

Earned Value Management for construction starts with three numbers

Earned Value Management for construction is useful because it forces schedule progress, budget and actual cost into the same conversation. Instead of asking only whether a project is 62% complete or whether monthly spending is high, EVM asks whether the value of completed work is consistent with both the approved plan and the money already spent.

The Project Management Institute defines planned value as the budgeted cost of work that should have been completed by the measurement date, earned value as the budgeted value of work actually performed, and actual cost as the amount spent to perform that work. From those three measures come the familiar performance indicators: schedule variance, cost variance, SPI and CPI. PMI’s earned value overview gives the same core definitions and formulas.

For construction teams, the mathematics is straightforward. The difficult part is building a baseline, progress-measurement system and cost structure that deserve to be trusted. A perfect CPI calculated from weak progress data is still a weak management signal.

Why ordinary percentage complete is not enough

A single project percentage can hide very different conditions. Two contractors may both report 60% progress, yet one may have completed the high-value permanent works while the other has mainly completed low-value preparatory activities. If progress is not weighted consistently, management can get a visually convincing number that does not represent economic or schedule performance.

EVM addresses this by valuing completed work using the approved budget. If an activity or control account carries 1 million SAR of budget and the agreed earning rule says 50% of that scope is complete, the corresponding earned value is 500,000 SAR. It is not the actual amount spent. It is the budgeted value of the work earned.

Earned Value Management for construction using schedule and cost data analysis
Project-controls data analysis. Illustrative Brainbay visual.

Earned Value Management for construction: the core formulas

The fundamental schedule indicator is Schedule Performance Index, SPI = EV / PV. An SPI of 1.00 means earned progress equals planned progress at the data date. An SPI below 1.00 means less budgeted work has been earned than planned. An SPI above 1.00 means more has been earned than planned. PMI likewise defines Cost Performance Index, CPI = EV / AC; CPI below 1.00 indicates that the project is spending more than the budgeted value it is earning, while CPI above 1.00 indicates favorable cost efficiency. PMI’s schedule-variance guidance confirms these cumulative SPI and CPI formulas.

Variances express the same relationships in absolute terms. Schedule Variance, SV = EV − PV, and Cost Variance, CV = EV − AC. Positive is favorable; negative is unfavorable. However, construction managers should remember that SV is expressed in cost units, not days. A negative SV therefore does not tell you the contractual completion delay or the number of days on the critical path.

Brainbay Tool Spotlight

The Brainbay Project Controls Analyzer is designed to validate Primavera P6 or Excel project data before presenting progress, BAC, PV, EV, AC, SPI and CPI. That sequence matters: calculation should follow data validation, not replace it.

1

Validate
Check project, data date, baseline and progress fields.
2

Calculate
Apply transparent EVM formulas and WBS rollups.
3

Investigate
Use schedule logic, float and activity detail to explain the KPI.

Explore Brainbay Platform

How to build credible EVM on a construction project

1. Start with an approved, time-phased baseline

PV must come from an approved baseline that reflects the scope, timing and budget allocation the project team is actually managing against. If activities are not properly resource- or cost-loaded, or if the time-phasing does not reflect the intended execution sequence, the planned-value curve becomes unreliable.

2. Align the WBS, cost codes and progress rules

The scheduling WBS, commercial cost structure and site progress breakdown do not need to be identical, but they must be reconcilable. A façade package measured by area, procurement package measured by weighted milestones and commissioning package measured by system turnover can all coexist, provided each earning rule is documented and consistently applied.

3. Define objective earning rules

Construction is vulnerable to subjective progress claims. Good earning methods reduce that subjectivity. Examples include weighted milestones for procurement, installed quantities for repetitive works, 0/100 or 50/50 rules for short activities, and approved physical-completion weights for engineering deliverables. The choice should fit the work, not the reporting preference of the month.

4. Cut off progress and cost at the same data date

EVM becomes distorted when progress is recorded to Friday but actual cost is only posted through the previous month. Accruals, commitments and delayed invoices need a consistent treatment. The comparison is meaningful only when EV and AC refer to the same work and the same reporting period.

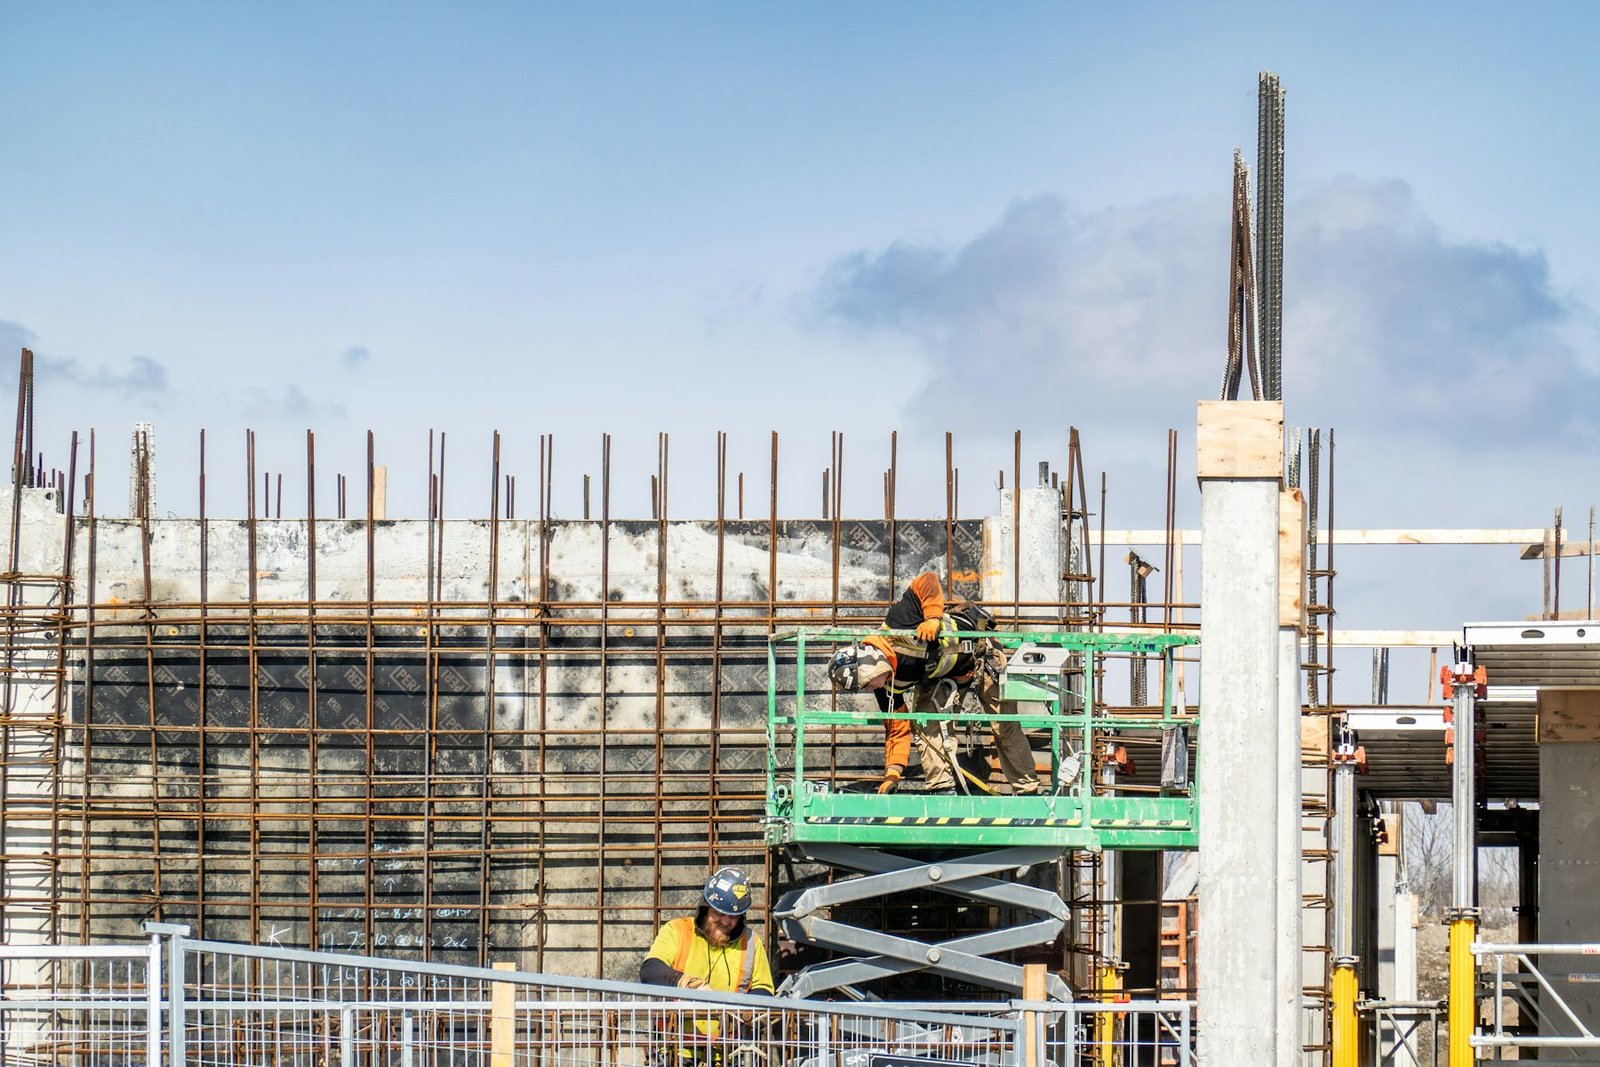
Construction progress review supporting earned value management and physical progress validation
Physical progress validation should support the earned-value calculation. Illustrative Brainbay visual.

How to read SPI and CPI without overreacting

Suppose a construction package has PV of 10.0 million SAR, EV of 8.8 million SAR and AC of 9.6 million SAR. SPI is 0.88, CPI is approximately 0.92, SV is −1.2 million SAR and CV is −0.8 million SAR. The project has earned only 88% of the work value it planned to earn, while every 1 SAR of actual cost is producing about 0.92 SAR of budgeted value.

Those numbers are a warning, not a diagnosis. The next question is why. A low SPI could come from late access, incomplete design, procurement delays, under-resourcing, resequencing or simply a baseline that no longer represents executable logic. A low CPI could reflect productivity loss, rework, overtime, price escalation, inefficient logistics, temporary works or a cost-accounting lag. Project controls must connect the KPI to the underlying schedule and field evidence.

Trend is usually more informative than a single period. An SPI moving from 0.98 to 0.94 to 0.89 deserves more attention than one isolated reading of 0.89 after a major planned milestone. The same applies to CPI. Management should look at cumulative and period indicators, WBS breakdowns and the direction of movement.

Do not use SPI as a substitute for CPM delay analysis

SPI measures earned work against planned work in value terms. It does not identify the critical path, contractual delay or entitlement to an extension of time. A project can have a weak SPI while its contractual completion milestone remains protected by available float, or it can show an apparently acceptable SPI while a small but critical sequence is slipping badly.

That is why construction reporting should pair EVM with CPM analysis. Review critical and near-critical paths, total float, milestone movement, longest path, constraints and changes to logic. For claims or EOT work, use the contractually required delay-analysis method rather than treating SV or SPI as proof of time entitlement.

Forecasting with EVM

EVM also supports cost forecasting. A simple efficiency-based forecast is EAC = BAC / CPI when current cost efficiency is expected to continue. Other EAC formulas can reflect different assumptions, for example where both cost and schedule performance are expected to affect the remaining work. The formula selected should match the project condition and be explained rather than automatically accepted from software.

The To-Complete Performance Index is another useful management test. It asks what future cost efficiency would be required to finish within a selected budget target. If the required efficiency is far better than anything achieved to date, the target may be unrealistic unless a credible recovery or scope strategy changes the underlying conditions.

Common construction EVM mistakes

  • Using subjective percentages without documented earning rules.
  • Calculating PV from a current programme instead of the approved performance baseline.
  • Mixing invoice dates, commitments and accruals inconsistently in AC.
  • Allowing scope changes into EV before budget and baseline approval.
  • Rolling up WBS values that use incompatible weighting systems.
  • Reporting SPI/CPI without explaining the critical-path or productivity drivers.
  • Treating an attractive dashboard as proof that the source data is correct.

What a useful monthly EVM review should contain

A practical monthly construction review should show BAC, PV, EV and AC at project and major WBS level; current and previous SPI/CPI; period and cumulative variances; forecast EAC; progress curves; critical-path status; major causes of variance; approved changes; and the corrective actions assigned to responsible teams. The purpose is not to produce more KPIs. It is to shorten the distance between an early warning and a management decision.

Brainbay’s project-controls platform follows that logic by connecting schedule validation, progress, earned value, risk and reporting rather than treating each metric as an isolated score.

Final takeaway

Earned Value Management is most valuable when it becomes a disciplined control process rather than a monthly formula exercise. Construction teams need an approved baseline, objective progress rules, synchronized cost data and a clear WBS before SPI and CPI deserve management confidence. Once those foundations are in place, EVM can expose schedule and cost pressure early, improve forecasting and focus attention on the packages that require action.

The strongest project-controls teams then go one step further: they connect the EVM signal back to CPM logic, physical quantities, productivity, procurement status, change control and field constraints. That is where a performance index becomes a decision tool.

Article Snapshot

Practical construction guide to PV, EV, AC, SPI, CPI, variance interpretation and forecasting.

Brainbay Tools

  • Project Controls Analyzer
  • Platform EVM workflow

Key Metrics

  • SPI = EV / PV
  • CPI = EV / AC
  • SV = EV − PV
  • CV = EV − AC

Verified Sources

Project Management Institute earned value guidance. Updated 1 Sep 2026.

Categories
Uncategorized

New Murabba Digital Twin Construction: Project Controls Lessons for Riyadh’s New Downtown

New Murabba digital twin construction and project controls illustration

New Murabba Digital Twin Construction: Project Controls Lessons for Riyadh’s New Downtown

Updated 31 August 2026 · Digital Twins · Project Controls

New Murabba digital twin construction is a useful case study for planners because it shows how a megaproject can treat data infrastructure as part of delivery rather than as a reporting add-on. New Murabba’s own website says AI and digital twins are intended to reduce waste, accelerate construction and optimize daily operations. That ambition matters for project controls because the value of a digital twin depends on whether schedule, design, progress, cost and asset data are connected to the same controlled decisions.

New Murabba digital twin construction in context

New Murabba is being developed by a Public Investment Fund company in north-west Riyadh. At MIPIM 2026, the developer described a destination covering more than 14 million square metres, with more than 90,000 residential units planned for more than 280,000 residents. The masterplan also highlights 25% dedicated green space, multimodal mobility and a 15-minute downtown concept.

The Mukaab remains the development’s signature landmark. New Murabba describes the structure as approximately 400 metres by 400 metres by 400 metres and positions it as a technology-enabled destination using systems such as AI, robotics and immersive digital experiences. Those figures describe the current official vision; they should not be read as evidence that every component is already operational or complete.

Digital twins are already more than a future concept

One of the strongest signals is not a rendering of the future city, but New Murabba’s own headquarters. In November 2025 the company said its Riyadh headquarters had achieved SmartScore Platinum with a perfect 100/100 score and included what it described as the Kingdom’s first operational digital twin. Developed in-house and powered by Autodesk Tandem, the system is used for real-time monitoring, simulation and optimization of building systems and technology infrastructure.

For project-controls teams, that distinction is important. A digital twin becomes useful when it has live or regularly synchronized data, clear ownership and a purpose. A static 3D model may support coordination, but a true operational twin should connect the asset to changing information so teams can test scenarios, detect anomalies and trace decisions.

Brainbay Tool Spotlight

Digital twins do not replace schedule control. They become more useful when linked to reliable programme data. The Brainbay Project Controls Analyzer supports schedule-focused review, while the Brainbay Platform is the current entry point for available project-controls tools. Automated findings should still be validated against the approved programme, data date and contractual reporting rules.

From 3D coordination to a controlled delivery model

The project-controls opportunity is to connect digital-twin information to the work breakdown structure. Design packages, construction zones, assets, inspections and commissioning systems should map to schedule activities and milestones. Without that mapping, a model can be visually impressive but difficult to use for delay analysis or management action.

A practical delivery chain could be: design object → package or location code → schedule activity → responsible contractor → progress evidence → inspection status → commissioning record. The objective is traceability. If a planner sees a delayed activity, the team should be able to identify which physical assets or areas are affected. If the twin highlights a stalled system or inaccessible zone, the schedule should show the consequence.

Technology partnerships point toward integrated construction intelligence

New Murabba has continued building its technology ecosystem. In June 2025 it signed a three-year MoU with NAVER Cloud to explore robotics, autonomous vehicles, a smart-city platform and digital solutions for monitoring construction progress. In July 2025 it signed an MoU with Honeywell covering automation, digital transformation and smart infrastructure. These are agreements to explore and enable capabilities, not proof that all systems have already been deployed across the development.

For planning engineers, the lesson is to separate announced capability from implemented control. A technology roadmap should therefore have measurable delivery gates: requirements agreed, platform architecture approved, data interfaces tested, pilot completed, production use accepted and benefits verified.

Phase 1 infrastructure needs the same digital discipline

New Murabba announced in January 2026 that Parsons had been appointed Infrastructure Lead Design Consultant for Phase 1. The scope covers design and integration of core utilities, mobility systems and transportation networks, translating concept designs into detailed constructible solutions. Infrastructure is exactly where digital coordination can prevent late interface failures because utilities, roads, structures and future development plots all compete for physical space and sequence.

A digital-twin strategy can support constructability reviews, but the planning baseline still has to contain the interface milestones. Utility diversions, enabling works, design freezes, procurement lead times and access handovers must appear in the schedule with accountable owners. A model cannot compensate for missing logic.

Four project-controls uses that matter

1. Progress validation by location

Location-based progress is often more actionable than one overall percentage. If model objects or zones can be associated with verified installation and inspection states, planners can compare the physical picture with the reported activity status. Differences become exception lists rather than arguments at the end of the month.

2. Interface and access management

Large mixed-use developments have many contractors sharing constrained work fronts. A digital environment can visualize upcoming conflicts, but the control process must still record who owns the clearance, when it is required and what successor activity depends on it.

3. Change impact analysis

When a design object changes, the team should be able to identify affected quantities, procurement packages, installed work and schedule activities. That traceability strengthens change control because the impact can be assessed using the same coding structure rather than reconstructed manually weeks later.

4. Handover readiness

At handover, the most valuable twin is not the most photorealistic. It is the one connected to approved asset information, testing records, warranties, O&M documentation and accepted as-built status. The transition from construction twin to operational twin should therefore be planned as a deliverable, not left to the final months.

What planners should not automate blindly

AI can help classify risks, detect anomalies and prioritize reviews, but project teams should be cautious about treating algorithmic output as a contractual conclusion. A predicted delay is a risk signal, not automatically an entitlement. Critical path, contemporaneous records, causation and contract provisions still determine how delay is assessed.

The same caution applies to progress. Computer vision, sensors or object status can support evidence, but the approved measurement methodology remains the basis of reporting. If a contract defines progress through inspected quantities or accepted deliverables, a model should feed that system rather than replace it.

An illustrative digital-twin control workflow

Illustrative — not official New Murabba project data: imagine a utility corridor scheduled for completion by a month-end data date. The schedule reports 80% complete, while model-linked inspection records show only 65% of installed assets accepted. The planner should not simply overwrite the schedule with 65%. Instead, the team reconciles quantities, inspection status, rejected work, measurement rules and late updates. The result may reveal a reporting cut-off issue, a quality hold point or genuine overstatement.

That reconciliation is where digital twins create value: they provide another controlled evidence layer and make inconsistencies visible earlier.

New Murabba digital twin construction lessons for project controls

The most important lesson is that digital transformation should be designed around decisions. New Murabba’s public strategy combines smart-city infrastructure, AI, digital twins, robotics and integrated mobility, while its headquarters already demonstrates an operational digital-twin use case. For planners, the opportunity is to connect these capabilities to the fundamentals: WBS, schedule logic, data dates, responsibilities, progress evidence and change control.

A megaproject becomes digitally mature when technology reduces the time between a physical event and a management decision without weakening traceability. If an access constraint appears, the schedule consequence should be visible. If an asset changes, the affected package should be identifiable. If progress is disputed, evidence should be retrievable. If handover is approaching, readiness should be measurable.

Digital twins can make that control environment faster and more transparent, but they work best when the underlying project-controls system is disciplined first.

Verified references

Current project facts in this article were checked against New Murabba’s official website and press releases covering its MIPIM 2026 presentation, operational headquarters digital twin, NAVER Cloud technology MoU, Honeywell collaboration and Parsons Phase 1 infrastructure appointment. Updated 31 August 2026.

Article Snapshot

How digital twins can support planning, progress, interfaces, change and handover on a megaproject.

Brainbay Tools

Platform · Project Controls Analyzer

Project-Control Themes

WBS · schedule logic · progress validation · interfaces · change · handover

Verified Sources / Updated

New Murabba official website and press releases · 31 August 2026

Categories
Uncategorized

Construction S-Curve: A Practical Guide to Progress Control

Construction S-curve project controls planning with technical drawings and laptop

Construction S-Curve: A Practical Guide to Progress Control

Updated 30 August 2026 · Project Controls

Construction S-curve reporting is one of the clearest ways to show whether a project is progressing broadly in line with its approved plan. The familiar cumulative curve can make a complex programme understandable in seconds, but that simplicity can also be dangerous. A polished chart is not evidence of a healthy project unless its schedule logic, progress measurement, weighting and data date are credible.

What a construction S-curve actually measures

An S-curve plots a cumulative quantity against time. In project controls, the vertical axis may represent weighted progress, labour hours, quantities, cost or earned value. The horizontal axis represents time. Many projects develop an S-like profile because progress starts slowly during mobilization and engineering, accelerates during peak construction, and flattens as testing, snagging and handover reduce the remaining volume of work.

For earned value management, the Project Management Institute describes Planned Value (PV) as the time-phased budget baseline and notes that a graph of cumulative PV is commonly referred to as an S-curve. Earned Value (EV) represents the budgeted value of work actually accomplished, while Actual Cost (AC) records what was spent to accomplish that work. These measures allow the chart to become more than a visual progress line.

Build the curve from a defensible baseline

The planned curve should come from an approved, time-phased baseline rather than percentages typed manually into a reporting sheet. Activities need sensible durations, calendars, relationships, constraints and resource or cost assignments. The WBS should also correspond to how the project will actually be measured.

A baseline with excessive constraints, open ends, unrealistic productivity or poorly distributed weights can generate a smooth curve while hiding weak planning assumptions. Before management relies on the graph, the planning team should be able to trace a point on the curve back to the underlying activities and explain why that amount of progress was planned by the reporting date.

Choose a progress basis and keep it consistent

Different packages may require different measurement rules. Engineering can be weighted by deliverables and approval stages. Procurement may use milestones such as purchase order, manufacturing, inspection, shipment and delivery. Construction is often better measured through installed quantities or weighted physical steps. Testing and commissioning may use system-based milestones.

The important control is consistency. Mixing cost expenditure, physical quantity and subjective percent complete without a controlled weighting structure can distort the overall result. A project can appear advanced simply because a heavily weighted activity has been credited too early.

Brainbay Tool Spotlight

Schedule analytics are most useful when the chart can be traced back to the programme. The Brainbay Project Controls Analyzer is designed around project-controls review, while the Brainbay Platform provides the current entry point for available tools. Always validate automated findings against the approved schedule and contractual reporting rules.

Planned versus actual is not enough

A common progress report shows only planned percent and actual percent. That comparison is useful, but it does not automatically distinguish work accomplished from money spent. Earned value adds a stronger performance framework by comparing PV, EV and AC on a common basis.

PMI defines Schedule Variance as EV minus PV and the Schedule Performance Index as EV divided by PV. An SPI of 1.00 means the value of completed work equals the value planned by that date; below 1.00 indicates less work has been earned than planned. Cost Performance Index is EV divided by AC. These indices are valuable signals, but they should not be treated as substitutes for schedule analysis.

In particular, an S-curve cannot tell management which delayed activity is driving the completion date. A project may be behind its cumulative plan because of non-critical work while its contractual milestone remains protected, or it may look close to plan while a small but critical sequence has slipped. The curve therefore belongs beside critical-path, float, milestone and look-ahead analysis.

Use the data date as the control line

Every monthly S-curve should have a clear status or data date. Actual and earned progress should stop at that date. Future values belong to the forecast. This sounds basic, yet reporting errors often arise when progress from different cut-off dates is combined, late information is backfilled inconsistently, or the schedule and cost systems close on different dates.

A disciplined reporting cycle freezes the cut-off, validates site quantities, updates schedule status, checks cost information, reconciles exceptions and only then publishes the cumulative curves. If late data is accepted after the cut-off, the report should state the rule clearly.

Read the shape, not just the variance

The gap between planned and earned curves matters, but so does the trend. A widening gap suggests that the project is losing ground. A stable gap may indicate that production has recovered to the planned rate but has not recovered the earlier delay. A narrowing gap suggests catch-up, although planners should confirm that the improvement comes from genuine production rather than changed weights or retrospective progress.

The monthly incremental values behind the cumulative chart are often even more revealing. Because cumulative curves naturally smooth volatility, a separate monthly histogram can expose declining production, a delayed ramp-up or an unrealistic future peak. Management should ask whether the remaining monthly output is physically achievable with the available work fronts, crews, materials and logistics.

Forecasting and recovery plans

When actual progress falls behind, simply drawing a steeper future line is not a recovery plan. The forecast should be rebuilt from remaining scope, realistic productivity, access dates, procurement constraints and current logic. If acceleration is proposed, the schedule should show where additional crews, shifts, work fronts or resequencing create the required gain.

For a credible recovery S-curve, the revised monthly production profile must reconcile with the updated programme. If the curve requires twice the historical installation rate, the team should identify the resources and work fronts that make that increase possible. Otherwise the recovery curve is only a target.

Five controls that make S-curves reliable

First, control the baseline. Changes to the planned curve should follow the project’s approved change-control process. Do not quietly rewrite history to make current performance look better.

Second, control weighting. The total weight should reconcile to 100 percent or to the approved budget basis, and package-level weights should reflect the agreed measurement method.

Third, validate physical progress. Progress should be supported by quantities, inspections, deliverables or other objective evidence appropriate to the scope.

Fourth, reconcile schedule and reporting systems. WBS codes, activity identifiers, cost codes and reporting periods should align sufficiently to explain variances without manual guesswork.

Fifth, preserve an audit trail. Retain prior-period values, approved baseline versions and explanations for corrections. A good report should allow another planner to reproduce the curve.

Illustrative example: interpreting a monthly variance

Assume an illustrative project planned to reach 60% weighted progress by the August data date but had earned 54%. The simple progress variance is -6 percentage points and the corresponding SPI is 54/60 = 0.90. This example is illustrative and is not official data from any project.

The number alone does not establish a six-point delay to completion. The planner should identify which WBS elements caused the gap, whether they are critical, how much float remains, whether successor work can proceed, and what production is required over the remaining periods. If most of the shortfall is on a critical façade sequence, the completion risk may be substantial. If it is on non-critical landscaping with available float, the milestone effect may be different.

What management should see each month

A strong dashboard normally combines the cumulative S-curve with current planned and earned percentages, monthly incremental progress, SPI where the EVM basis is valid, milestone variance, critical-path narrative, major constraints and a short forecast. The chart should answer three questions: Where should we be? Where are we now? What has to happen next?

The most useful commentary is specific. Instead of saying “progress is delayed,” identify the responsible work package, the cause, the effect on the near-term sequence, the mitigation action and the decision needed from management. That turns the S-curve from a presentation graphic into a control instrument.

Construction S-curve lessons for planning engineers

A construction S-curve is powerful because it compresses a large schedule into a recognizable trend. It is weak when used in isolation. Reliable reporting requires a controlled baseline, objective progress measurement, consistent weighting, a fixed data date and direct reconciliation with the schedule.

The best planning engineers use the curve as an entry point for investigation. When the line moves, they ask what changed in the underlying WBS. When it does not move as expected, they investigate access, resources, procurement, productivity and logic. And when a recovery curve is proposed, they test whether the programme can actually deliver it.

That discipline is what makes an S-curve useful for decisions rather than decoration.

Verified references

Project-controls definitions and formulas in this article were checked against the Project Management Institute’s earned-value guidance and PMI material on monitoring performance against the baseline. Updated 30 August 2026.

Article Snapshot

Practical construction S-curve setup, interpretation, forecasting and controls.

Brainbay Tools

Platform · Project Controls Analyzer

Project-Control Themes

PV · EV · AC · SPI · CPI · baseline · data date · critical path

Verified Sources / Updated

Project Management Institute · 30 August 2026

Categories
Uncategorized

Qiddiya Smart City: AI, Construction Intelligence and Project Controls Lessons

Qiddiya smart city AI construction and project controls

QIDDIYA CITY · SMART DELIVERY

Qiddiya Smart City: AI, Construction Intelligence and Project Controls Lessons

How a city-scale entertainment programme can connect construction milestones, live data and AI-enabled operations.

Qiddiya smart city development is becoming a useful case study for planning engineers because the programme is no longer only about building individual attractions. Qiddiya Investment Company is connecting construction delivery, destination operations and artificial intelligence on one digital foundation. That changes the project-controls question from “What percentage is complete?” to “What information must be trusted now so the city can operate intelligently later?”

In 2026, that question is practical rather than theoretical. Six Flags Qiddiya City welcomed its first guests in December 2025, while Aquarabia officially opened on 23 April 2026. At the same time, Qiddiya says work continues on major assets including the Speed Park Track, and the Sir Nick Faldo-designed championship golf course is scheduled to open in 2026. The development is therefore moving through several lifecycle stages at once: construction, testing, opening, operation and continued expansion.

Qiddiya smart city is now a live project-controls environment

Qiddiya Investment Company describes Qiddiya City as a development of more than 360 square kilometres with more than 20 districts. The wider plan includes entertainment, sports, culture, homes, workplaces and public infrastructure. A programme of that scale cannot be controlled effectively through one master schedule alone. It needs a hierarchy of programmes, common coding, milestone governance and a reliable way to connect physical delivery with operational readiness.

The latest digital development is especially relevant. QIC announced an expanded collaboration with Google Cloud, implemented with systems integrator Master Works, to establish a city-wide data and AI foundation. According to QIC, the platform will provide near-real-time insight into construction milestones, visitor demand and operational efficiency, reducing time-to-insight from weeks to minutes.

That statement has an important implication for project controls: schedule data is becoming part of an operational information system. A milestone is no longer useful only because it appears in a monthly report. It may feed executive decisions, commissioning priorities, visitor planning, asset readiness and downstream digital services.

BRAINBAY TOOL SPOTLIGHT

Validate the programme before automating the insight

Brainbay can help planners review Primavera P6/XER or Excel project data for schedule quality, logic, constraints, progress, earned value and forecast indicators before those results are used in dashboards or AI workflows.

Explore the Brainbay Platform · Open the Project Analyzer

What Qiddiya’s AI architecture means for construction teams

QIC identifies three technology pillars: an AI Factory enabled by the Gemini Enterprise Agent Platform, an agentic AI platform called Q-Brain, and a unified data platform built on BigQuery. The operational examples published by QIC focus heavily on visitor behaviour and city operations, but the same announcement explicitly includes construction milestones among the real-time inputs.

For construction and project-controls teams, the lesson is not to hand schedule decisions to an AI model. The lesson is to make the underlying project data structured enough that AI can support faster review. That requires controlled activity IDs, consistent WBS and location codes, approved baselines, reliable actual dates, disciplined progress rules and clear ownership of constraints.

1. Milestones need a common definition

If one contractor defines “complete” as physical installation while another defines it as inspection approval, a city-wide data platform will simply accelerate inconsistent information. Programme governance must define what each key milestone means, which evidence proves it, who approves it and when it becomes eligible for reporting.

2. Construction data needs operational context

Theme parks, sports venues, studios, hospitality assets and transport systems do not become operational at the moment civil works finish. Testing, authority approvals, training, rehearsals, soft openings, operator acceptance and public-opening readiness can all sit beyond traditional construction completion. Qiddiya’s current transition illustrates why these milestones should be visible in the integrated programme from the start.

Qiddiya smart city construction progress measurement workflow
Illustrative construction-progress workflow. Reliable AI insight still depends on verified source data.

Qiddiya smart city lessons for schedule intelligence

A planner working on a city-scale programme should think in layers. The top level communicates strategic opening and interface milestones. The control schedule manages packages and handovers. Detailed contractor programmes manage executable activities. The digital layer then connects approved status from those schedules with other systems such as document control, cost, BIM, inspections and operations.

This is where AI can add value. It can help surface exceptions, compare versions, summarize constraint trends and direct attention to packages whose forecast movement threatens an opening milestone. But an AI-generated warning should remain traceable to the activity, logic path, status date and source record that produced it.

A practical exception-based workflow

  1. Validate the data date, baseline and activity coding.
  2. Check missing logic, excessive constraints, negative float and open ends.
  3. Compare current forecast dates with approved milestone commitments.
  4. Link critical interfaces to design, procurement, access, testing and operator readiness.
  5. Use AI to rank exceptions and draft explanations, not to replace schedule calculation.
  6. Assign actions, owners and required dates, then verify closure at the next update.

This approach is particularly important when a destination is partially operational while construction continues elsewhere. Operational assets introduce live interfaces that may change access, logistics, safety restrictions and working windows for remaining packages.

Recent Qiddiya milestones show why phase control matters

Qiddiya is already demonstrating phased delivery. Six Flags Qiddiya City opened to its first guests in December 2025. Aquarabia moved through a soft-opening period in March 2026 and officially opened on 23 April 2026. QIC also opened PlayMaker Studios and stated that construction had started on two additional soundstages scheduled for completion in 2026.

Meanwhile, the city continues developing other assets. Qiddiya’s August 2026 update for the FIA Extreme H World Cup says work continues on the Speed Park Track, while the championship golf course is due to open later in 2026. The second Extreme H World Cup at Qiddiya is scheduled for 29–31 October 2026.

For a project-controls team, these are not isolated publicity dates. Each public milestone implies a network of preceding dates: design release, procurement, installation, systems completion, integrated testing, authority approvals, operator mobilization, training and readiness. A robust programme makes those dependencies visible before the headline date is threatened.

Illustrative readiness chain

Design freeze → Procurement → Installation → Testing → Authority/Operator Acceptance → Soft Opening → Public Opening

Illustrative project-controls sequence; not Qiddiya’s official contractual programme.

Smart-city AI does not remove the need for planning discipline

The strongest lesson from Qiddiya’s digital direction is that AI magnifies the quality of the information system underneath it. A unified platform can shorten reporting cycles, but it cannot make an unapproved actual date reliable. An agent can summarize schedule risk quickly, but it cannot decide whether a contractor’s remaining duration is achievable without credible productivity and resource assumptions.

Planning engineers therefore become more important, not less. Their role shifts toward data governance, exception management and decision support. They need to understand both the schedule mechanics and the information chain feeding management dashboards.

For teams adopting similar workflows, start small. Connect one approved schedule update to one progress dataset and one constraint log. Agree the coding structure. Reconcile the numbers. Automate only after the manual result is trusted. Then expand to procurement, BIM, cost and operations.

What project-controls teams should take from Qiddiya

Qiddiya City shows how the boundary between construction technology and operational technology is narrowing. Its Google Cloud collaboration is designed to create a single data foundation across the destination, with AI supporting faster insight and decision-making. For planners, the opportunity is to make schedule intelligence part of that same trusted information chain.

The practical priority remains familiar: good logic, clear milestones, verified progress, controlled baselines and accountable interfaces. AI can make those controls faster to interrogate and easier to communicate. It should not make them less rigorous.

As more Saudi giga-projects move from construction into phased operations, the best project-controls systems will be the ones that can explain not only what has been built, but what is truly ready, what is at risk next, and which evidence supports the forecast.

Article Snapshot

Qiddiya’s AI and data strategy connects construction milestones with future smart-city operations.

Brainbay Tools

Platform · Project Analyzer

Project-Control Themes

Milestones · interfaces · readiness · schedule intelligence · AI governance

Verified Sources

QIC + Google Cloud · Aquarabia opening · Extreme H update

Updated 29 Aug 2026

Categories
Uncategorized

Schedule Health | Brainbay P6

Brainbay · Schedule Health

P6 Schedule Health Analyzer

Upload a Primavera P6 XER, XML or Excel schedule, validate the project-controls logic first, then generate a professional Excel and PDF report with DCMA-style schedule-health checks, constraints, float and risk intelligence.

P6 XER / XML / Excel in. Validate first. Excel + PDF out.

01

Analyze faster

Turn raw P6 schedule data into a management-ready schedule-health review in minutes.

02

Find schedule risk

Surface missing logic, hard constraints, negative float, out-of-sequence and long-duration activities.

03

Ready for decisions

Get a transparent Health Score, findings register and printable Excel/PDF reports from one upload.

Brainbay checks Project ID, Data Date, WBS, relationships, calendars, constraints and activity codes before creating the .xlsx and .pdf reports.

Schedule Assurance

DCMA-style checks: missing logic, relationships, constraints, float and risk classification.

Constraint Analysis

Mandatory, start/finish-on, ALAP and soft constraints on critical and near-critical activities.

Float Intelligence

Negative, critical, near-critical, normal and excessive float with transparent thresholds.

Critical Path

Current longest-path activities summarized by WBS, remaining duration and total float.

Out-of-Sequence

Progress conflicting with network logic, plus actual-date and remaining-duration validation.

Health Score

0–100 score with an open breakdown: EXCELLENT, GOOD, NEEDS ATTENTION or HIGH RISK.

Illustrative Schedule Health output

Example assessment for a representative programme (illustrative only).

82
4,892
Activities
312
Critical
48
Negative Float
96
Missing Logic
23
Constraints
Schedule Health Score82
Logic Integrity74
Constraint Health88
Float Balance79
Secure workflow Your P6 XER / XML / Excel schedule files are used only for validation, analysis and Excel / PDF generation — processed in your browser.

How the Brainbay P6 Schedule Health analyzer supports better controls

Brainbay’s Primavera P6 schedule-health analyzer converts raw schedule data into a structured project-controls review. It checks logic, constraints, float, progress sequencing and risk while keeping every calculation visible to the user. Planning engineers can trace each result back to the uploaded XER, XML or Excel source instead of relying on a black-box score.

The workflow is designed for schedule reviews, progress updates, recovery planning and management reporting. Users can review exceptions, apply transparent thresholds (long-duration, near-critical float and excessive lag) and prepare clearer discussions with contractors, consultants and project teams. For product capabilities, visit the Brainbay platform overview or explore the project-controls dashboard demo.

Run the Schedule Health analyzer

The interactive tool runs below. Upload a Primavera P6 XER / XML / Excel schedule to validate it and generate the Excel + PDF health report. Your file is processed entirely in your browser.

Categories
Uncategorized

Brainbay Project Controls Tools | P6 Schedule Intelligence

P6 Project Controls Tools

Brainbay Tools

Four connected Primavera P6 analysis tools. Upload a XER, XML or Excel schedule, validate first, then generate a professional Power BI or Excel/PDF report. Sign in to run an analysis.

Project Analyzer
Full P6 review: progress, variance, schedule health, logic, risk, cost, earned value, look-ahead and update intelligence in one PBIX.

Open tool →

Schedule Health
DCMA-style audit of logic, constraints, float, lags, milestones and calendars. Exports a printable Excel + PDF report with a transparent health score.

Open tool →

Compare Schedules
Compare two updates (baseline vs current vs previous). Surface milestone movement, driving-path changes and recovery tracking in Power BI.

Open tool →

Progress & EVM
Reconcile Planned vs Actual progress on one time-phased basis, then compute SPI, CPI, EAC and productivity in Power BI.

Open tool →

Your first 3 successful P6 XER or Excel analyses are free. Preflight validation does not use a credit. Schedule files are used only for validation, analysis and report generation.
Categories
Uncategorized

Brainbay Progress & EVM | P6 Project Controls

P6 Progress & EVM

Progress & EVM

Upload a Primavera P6 XER/Excel schedule, validate Planned vs Actual Progress, then generate a Power BI report with BAC, PV, EV, AC, SPI, CPI, EAC and productivity intelligence.

01
Planned vs actual
02
SPI & CPI
03
Forecast EAC

Brainbay checks Project, Data Date, baseline, BAC, PV, EV, AC, Planned Progress, Actual Progress, SPI and CPI — so planned progress and actual progress are reconciled on the same time-phased basis before creating the .pbix.

Sign in to review progress →

Illustrative Power BI progress & EVM output
Planned vs actual, reconciled
% Complete
62.4%
SPI
0.92
CPI
0.88
Planned vs Actual % by WBS
Project A · Plan 84% / Actual 84%

Engineering · Plan 72% / Actual 71%

Procurement · Plan 58% / Actual 56%

Construction · Plan 48% / Actual 45%

Commissioning · Plan 23% / Actual 21%

Illustrative output. Planned and actual are reconciled on the same time-phased basis.

How Brainbay Progress & EVM supports better controls

Brainbay’s progress and earned-value tool reconciles Planned Progress and Actual Progress on one time-phased basis, then computes SPI, CPI, EAC and productivity so management sees variance early — not at close-out. Every figure traces back to the uploaded XER/Excel, with rules of credit and cut-off dates visible to the reviewer instead of hidden in a black box. The report supports monthly updates, forecasting and contractor discussions, and pairs with the Project Analyzer, Schedule Health and Compare Schedules tools. This is also where the planned-progress calculation you flagged is validated before the PBIX is built.

Why earned value management matters for P6 project controls

Earned value management (EVM) is the discipline that tells you whether a project is ahead or behind, not just on time but on cost. When you reconcile planned progress and actual progress on one time-phased basis, the schedule-to-date indices — SPI for schedule and CPI for cost — become trustworthy signals rather than cosmetic percentages. Brainbay Progress & EVM exists to make that reconciliation routine: upload the XER or Excel, let the tool validate the baseline and data date, and read SPI, CPI, EAC and productivity from a single report instead of a spreadsheet chase.

Planned vs actual progress, on the same basis

The most common EVM error is comparing planned percent complete to actual percent complete that were earned on different bases. Brainbay forces both onto the same time-phased curve before any index is computed, so an SPI of 0.92 means what it says: the project is delivering 92% of the value it planned to date. That single correction removes most of the monthly argument between planner and cost engineer.

Forecasting EAC without guesswork

Once SPI and CPI are reliable, the estimate at completion (EAC) stops being a hope and becomes a defensible number tied to performance to date. Brainbay surfaces EAC alongside BAC, PV, EV and AC so management sees the gap early and can decide on recovery while there is still schedule to recover. For owners running multiple packages, this is the difference between finding out at close-out and steering at month six.

Pairing Progress & EVM with the rest of Brainbay

Progress & EVM does not sit alone. The same XER that feeds earned value also feeds the Schedule Health checker and the Compare Schedules tool, so the forecast, the logic quality, and the update-to-update movement all come from one source of truth. That is what lets a controls team answer the only question an owner really asks: are we on track, and if not, what moves the finish date.

Categories
Uncategorized

Brainbay Compare Schedules | P6 Project Controls

P6 Compare Schedules

Compare Schedules

Upload two Primavera P6 XER/Excel updates, compare baseline vs current vs previous, then generate a Power BI report with milestone movement, driving-path changes and recovery tracking.

01
Milestone drift
02
Driving paths
03
Recovery view

Brainbay aligns activities by ID, compares data dates, and surfaces moved milestones, changed logic, re-sequenced float and new critical paths before creating the .pbix.

Sign in to compare updates →

Illustrative Power BI comparison output
Baseline vs current vs previous
Milestones moved
21
Slipped > 5d
14
New crit. path
9
Finish-date movement by WBS
Project A

+34d

Engineering

+8d

Procurement

+22d

Construction

+41d

Commissioning

+29d

Illustrative output. Real results derive from your uploaded XER/Excel.

How Brainbay Compare Schedules supports better controls

Brainbay’s comparison tool turns two schedule updates into a clear change story: which milestones moved, which logic changed, and which driving paths now govern the finish date. Planners can trace every movement back to the specific activity, relationship or constraint in the uploaded XER/Excel — no black-box delta. The report supports update-to-update reviews, recovery tracking and contractor discussions, and pairs with the Project Analyzer, Schedule Health and Progress & EVM tools.

Why comparing Primavera P6 schedules update to update matters

A Primavera P6 schedule is only as honest as its last update, and the value is in the delta between updates, not the snapshot. Brainbay Compare Schedules turns two XER or Excel updates into a clear change story: which milestones moved, which logic changed, and which driving paths now govern the finish date. Instead of eyeballing two Gantt charts, planners read a ranked list of movements traced back to the exact activity, relationship or constraint that caused them.

Milestone drift and the finish date

Most delay shows up first as milestone drift, long before the critical path visibly moves. By aligning activities by ID across data dates, Brainbay surfaces milestones that slipped more than five days and the WBS they sit in, so recovery conversations start with the right package. The illustrative output shows finish-date movement by WBS — the kind of view a contractor dispute turns on.

Driving paths and recovery tracking

When logic changes, the driving path can shift silently. Brainbay flags new critical paths and re-sequenced float so the recovery plan targets the activities that actually govern the date, not the ones that look busy. Tracked update to update, this becomes a recovery narrative management can trust during a claim or a monthly review.

Compare Schedules alongside the Brainbay suite

The same two updates that feed comparison also feed the Progress & EVM report and the Schedule Health checker. One upload, three views — movement, value, and logic quality — all from the same source file, with nothing hidden in a black box.

Categories
Uncategorized

Brainbay Schedule Health | P6 Project Controls

Brainbay · Schedule Health

P6 Schedule Health Analyzer

Upload a Primavera P6 XER, XML or Excel schedule, validate the project-controls logic first, then generate a professional Excel and PDF report with DCMA-style schedule-health checks, constraints, float and risk intelligence.

P6 XER / XML / Excel in. Validate first. Excel + PDF out.

01

Analyze faster

Turn raw P6 schedule data into a management-ready schedule-health review in minutes.

02

Find schedule risk

Surface missing logic, hard constraints, negative float, out-of-sequence and long-duration activities.

03

Ready for decisions

Get a transparent Health Score, findings register and printable Excel/PDF reports from one upload.

Brainbay checks Project ID, Data Date, WBS, relationships, calendars, constraints and activity codes before creating the .xlsx and .pdf reports.

Schedule Assurance

DCMA-style checks: missing logic, relationships, constraints, float and risk classification.

Constraint Analysis

Mandatory, start/finish-on, ALAP and soft constraints on critical and near-critical activities.

Float Intelligence

Negative, critical, near-critical, normal and excessive float with transparent thresholds.

Critical Path

Current longest-path activities summarized by WBS, remaining duration and total float.

Out-of-Sequence

Progress conflicting with network logic, plus actual-date and remaining-duration validation.

Health Score

0–100 score with an open breakdown: EXCELLENT, GOOD, NEEDS ATTENTION or HIGH RISK.

Illustrative Schedule Health output

Example assessment for a representative programme (illustrative only).

82
4,892
Activities
312
Critical
48
Negative Float
96
Missing Logic
23
Constraints
Schedule Health Score82
Logic Integrity74
Constraint Health88
Float Balance79
Secure workflow Your P6 XER / XML / Excel schedule files are used only for validation, analysis and Excel / PDF generation — processed in your browser.

How the Brainbay P6 Schedule Health analyzer supports better controls

Brainbay’s Primavera P6 schedule-health analyzer converts raw schedule data into a structured project-controls review. It checks logic, constraints, float, progress sequencing and risk while keeping every calculation visible to the user. Planning engineers can trace each result back to the uploaded XER, XML or Excel source instead of relying on a black-box score.

The workflow is designed for schedule reviews, progress updates, recovery planning and management reporting. Users can review exceptions, apply transparent thresholds (long-duration, near-critical float and excessive lag) and prepare clearer discussions with contractors, consultants and project teams. For product capabilities, visit the Brainbay platform overview or explore the project-controls dashboard demo.

Run the Schedule Health analyzer

The interactive tool runs below. Upload a Primavera P6 XER / XML / Excel schedule to validate it and generate the Excel + PDF health report. Your file is processed entirely in your browser.

Analyzing your P6 schedule

Preparing schedule-health analysis…

Categories
Uncategorized

Aramco Stadium Al Khobar: Construction, Design and Project Controls Lessons

Saudi Giga Projects

Aramco Stadium Al Khobar: Construction, Design and Project Controls Lessons

Aramco Stadium construction is delivering a 47,000-seat tournament venue on the Arabian Gulf — owned by ROSHN, operated by Saudi Aramco and designed by Populous.

Aramco Stadium construction lessons for project-controls teams

Aramco Stadium construction is one of the most closely watched sports-venue programmes on Saudi Arabia’s Eastern Province coast. Announced by Saudi Aramco on 31 July 2024, the approximately 47,000-seat stadium in Al Khobar is being developed as an asset owned by the ROSHN Group and operated by Saudi Aramco. It is planned to become the home ground of Al-Qadsiah FC and is scheduled to host matches at the 2027 AFC Asian Cup and the 2034 FIFA World Cup.

For planners and project-controls professionals, the scheme is a clean case study in fixed-date, tournament-driven delivery: an international design lead, a local-plus-international contracting joint venture, and a developer-owner model where the operating business case must outlast the headline event. This article sets out the verified facts and the delivery lessons that apply to large Saudi construction programmes.

1. The Aramco Stadium project at a glance

Aramco Stadium sits in the north of Al Khobar on a coastal site along the Arabian Gulf. The development spans roughly 800,000 square metres as part of a wider Sports City district, with around 9,000 parking spaces and a pitch measuring 105 metres by 68 metres. Cost is reported at SAR 3.7 billion (about US$1 billion), with a completion target of late 2026.

  • Location: Al Khobar, Eastern Province, Saudi Arabia (Arabian Gulf coast)
  • Capacity: ~47,000 seats for football; up to ~55,000 for concerts
  • Owner: ROSHN Group · Operator: Saudi Aramco
  • Architect: Populous (concept by Foster + Partners)
  • Interior / hospitality: Jump Studios (Populous company)
  • Main contractors: BESIX and ALBAWANI
  • Cost: SAR 3.7 billion (~US$1 billion) · Site: ~800,000 m²
  • Announced: 31 July 2024 · Target completion: late 2026
  • Tournaments: 2027 AFC Asian Cup; 2034 FIFA World Cup (FIFA-compliant to quarter-final)
  • Sustainability: Targeting LEED Gold certification
Aramco Stadium spiralling facade of overlapping translucent sails in Al Khobar by Populous
The spiralling Aramco Stadium facade of overlapping translucent sails, designed by Populous for the Al Khobar waterfront. Render © Populous.

2. Design and architecture inspired by the Gulf

The stadium’s defining feature is a spiralling exterior intended to evoke the waves, whirlpools and sails of the Arabian Gulf. Populous describes the facade as overlapping curved panels modelled on “the graceful rotation of waves and the spiral motifs commonly found in nature.” Openings within the panels let natural light into the concourses, where ramps and walkways follow the exterior spiral down to the seating bowl.

The bowl is shaped elliptically to minimise the building’s footprint and optimise natural ventilation, with a cooling system enhancing comfort in the seating bowl and select concourse areas. Populous states the configuration gives uninterrupted views of the pitch from every seat. Jump Studios leads the GA, hospitality, VIP and VVIP interior concept.

Aramco Stadium elliptical seating bowl with uninterrupted pitch views by Populous
The elliptical Aramco Stadium seating bowl is shaped for natural ventilation and uninterrupted pitch views. Render © Populous.

3. Aramco Stadium construction: delivery model and contracting

Aramco Stadium construction separates three roles that often blur on smaller jobs: the owner/developer (ROSHN Group), the operator (Saudi Aramco) and the design lead (Populous), executed by a BESIX and ALBAWANI joint venture. This structure is typical of tournament-ready mega venues, where a fixed external deadline sits above normal commercial drivers.

The owner-operator split means the design must satisfy both a capital-delivery budget and a decades-long operating business case — which is why Populous Consulting produced a post-tournament viability plan focused on visitor experience, community relations and commercial viability rather than treating the stadium as a single-event build.

Brainbay Tool Spotlight

Fixed-date tournament programmes need fast visibility into weak logic, float movement and changing completion paths.

Analyze your Primavera P6 XER file
Review logic, constraints, float and schedule-health issues.

Compare schedule updates
Track milestone movement, driving paths and recovery changes.

Progress & EVM analytics
Connect progress trends with management reporting.

Analyze a Primavera P6 XER file →

4. Project controls lesson — defend the baseline

With a 2027 tournament commitment, the schedule is not a soft target. The discipline that matters is a clean, agreed baseline and a transparent link between design release, procurement and the construction sequence. Teams should build the master schedule around irreversible dates — tournament windows, utility tie-ins, commissioning — and protect them with float, not hope. Our Primavera P6 planning framework for mega projects covers how to structure that baseline.

Aramco Stadium 800,000 square metre Sports City masterplan in Al Khobar by Populous
The ~800,000 m² Aramco Stadium masterplan forms part of Al Khobar’s Sports City district. Render © Populous.

5. Climate drives the plan, not just the MEP

The elliptical bowl and panel openings are ventilation strategies as much as architecture. On Gulf-coast sites, cooling load and worker-safety windows are schedule risks in their own right. Early climate modelling should feed the construction plan — not just the building services design — because extreme-temperature periods constrain productive shifts and concrete-placement windows.

6. Progress measurement the owner, operator and contractors all trust

A SAR 3.7 billion build with an international designer and a joint-venture contractor needs progress measurement that every party accepts. That means agreed quantities, rules of credit and cut-off dates before the first monthly report. See our guide to construction progress measurement management can trust for the practical setup, and translate the long-range programme into a reliable two-week look-ahead with clear workfronts, quantities, resources and constraints.

Aramco Stadium public realm and approach in Al Khobar by Populous
The Aramco Stadium approach and public realm are designed as a year-round community destination. Render © Populous.

7. Split mitigation from recovery, and keep a delay chronology

Tournament venues carry both known risks (supply lead times, specialist facade panels) and shock risks (weather, labour, logistics). Teams should keep a recovery plan separate from a mitigation plan, and maintain a delay-event chronology so any slip is documented with cause, effect and responsibility from day one.

8. AI and reporting compress the feedback loop

With a joint-venture contractor and an international design lead feeding the same programme, fast, verified reporting matters. The same principles behind AI in construction planning and connecting Primavera P6 to Power BI apply here: automate the routine, keep a human in the verification loop, and turn schedule rows into a management view the owner can act on.

How Aramco Stadium compares with other Saudi programmes

Aramco Stadium follows the same pattern as other Eastern Province and Red Sea developments: a developer-owner, an international design signature, a tournament or opening date as the critical path, and an operating business case that outlasts the headline event. The Shura Island Red Sea lessons and the AMAALA Triple Bay update show the same disciplines — logistics, phased handover and integrated controls — applied at different scales.

Conclusion

Aramco Stadium construction is a fixed-deadline, tournament-driven build: a 47,000-seat venue owned by ROSHN, operated by Saudi Aramco, designed by Populous and built by BESIX and ALBAWANI, targeting completion in late 2026 and LEED Gold certification. Beyond the architecture, its value to the industry is the delivery model — a clear owner-operator-design-build split, a defended schedule, and a business case that survives the final whistle. For project-controls teams, it is a timely reminder that on mega programmes the plan is only as good as the baseline, the progress measurement and the look-ahead that actually reaches the site.

Sources

Project facts were verified against the official Aramco Stadium construction announcement, the Populous Aramco Stadium showcase, and the Dezeen design release. Render imagery © Populous.

Article Snapshot

Topic: Aramco Stadium construction, design and project controls

Primary keyword: Aramco Stadium construction

Focus: Delivery model, baseline, climate, progress, handover

Brainbay Tools

  • Project Analyzer
  • Schedule Health
  • Compare Schedules
  • Progress & EVM

Project-Control Themes

  • Fixed-date baseline
  • Climate-aware planning
  • Readiness-based progress
  • Interface control

Verified Sources

Official Aramco Stadium, Populous and Dezeen updates were used for project facts.

Updated: 27 Aug 2026